Example of using esgf-pyclient to plot via OPeNDAP
Sun 24 February 2013
First import the required modules and select the CEDA ESGF-index node's search service.
from pyesgf.search import SearchConnection
from netCDF4 import Dataset
from mpl_toolkits.basemap import Basemap

CEDA_SERVICE = 'http://esgf-index1.ceda.ac.uk/esg-search/search'
Let's ask the question "How many datasets from the HadCM3 decadal2000 simulations do we have at daily time frequency?"
conn = SearchConnection(CEDA_SERVICE, distrib=False)

ctx = conn.new_context()
ctx = ctx.constrain(project='CMIP5', model='HadCM3', experiment='decadal2000', time_frequency='day')
print 'Hits:', ctx.hit_count
print 'Realms:', ctx.facet_counts['realm']
print 'Ensembles:', ctx.facet_counts['ensemble']
Hits: 40
Realms: {u'atmos': 20, u'ocean': 20}
Ensembles: {u'r4i2p1': 2, u'r2i2p1': 2, u'r5i2p1': 2, u'r10i2p1': 2, u'r3i2p1': 2, u'r9i2p1': 2, u'r7i2p1': 2, u'r5i3p1': 2, u'r8i3p1': 2, u'r3i3p1': 2, u'r6i3p1': 2, u'r9i3p1': 2, u'r1i2p1': 2, u'r7i3p1': 2, u'r8i2p1': 2, u'r6i2p1': 2, u'r4i3p1': 2, u'r1i3p1': 2, u'r10i3p1': 2, u'r2i3p1': 2}
We have 40 datasets. We've also asked which realms they are in and what ensembles are available. Next select a realm and ensemble and confirm we have a single dataset.
ctx = ctx.constrain(realm='ocean', ensemble='r1i2p1')
ctx.hit_count
1
Next we drill-down to find an OPeNDAP URL for one of the dataset's aggregations. There is some inside knowledge here as the first aggregation does not have an OPeNDAP endpoint.
result = ctx.search()[0]
agg_ctx = result.aggregation_context()
agg = agg_ctx.search()[1]
print agg.opendap_url
http://cmip-dn1.badc.rl.ac.uk/thredds/dodsC/cmip5.output1.MOHC.HadCM3.decadal2000.day.ocean.day.r1i2p1.tos.20110708.aggregation.1
We now open the dataset using netCDF4-python, select the variable "tos" and confirm it's shape.
d = Dataset(agg.opendap_url)
tos = d.variables['tos']
print tos.shape
(3660, 144, 288)
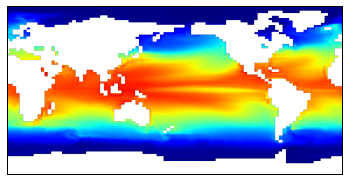
We can plot the first timeslice of this dataset. Better plotting is possible but imshow() gives you a quick look.
b = Basemap()
b.imshow(tos[0])
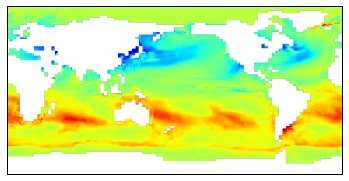
Finally let's do some simplistic data analysis. Plot the difference between the first day and 1 month afterwards.
b.imshow(tos[30]-tos[0])
Category: Data Science Tagged: esgf opendap